ANALYSIS

This page would be updated when needed. (Last update at 2013/04/22.

Section A: Analysis of 2012.

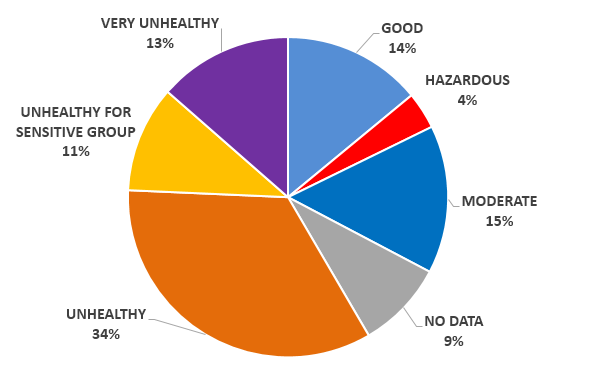
Here are total 214 days (photos) for the year 2012 as the sampling rate is 58.47%.

In these 214 days:

Good: 14%;
Moderate: 15%;
Unhealthy for sensitive group: 11%;
Unhealthy: 34%;
Very unhealthy: 13%;
Hazardous: 4%;
No data: 9%.

2012 Analysis


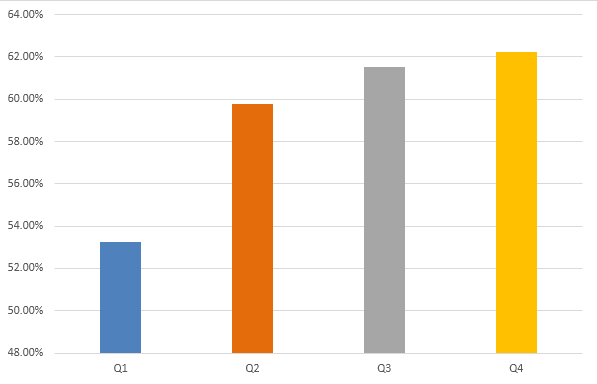
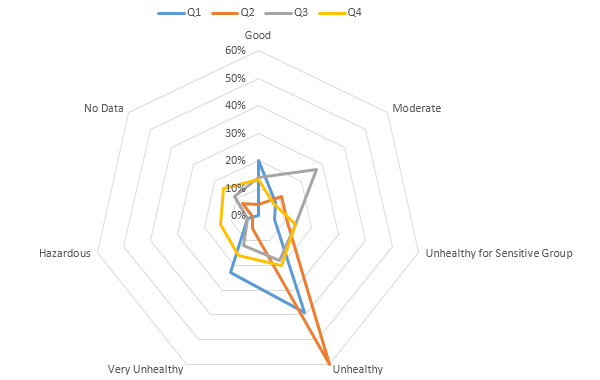
Section B: Analysis by quarter of 2012.

The sampling rates by quarter of 2012 (from 2012/03 to 2013/02):

Sampling Rate of 2012 by Quarters

Here is the analysis by quarter of 2012 (from 2012/03 to 2013/02):

2012 Analysis By Quarter


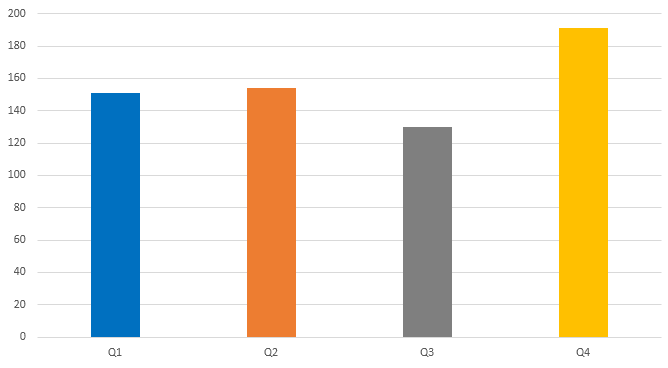
The average PM2.5 in 2012 is 156.6; by quarters:

Q1: 151;
Q2: 154;
Q3: 130;
Q4: 191.

Average PM2.5 of 2012 by Quarter


Remark:

  1. The data used by this website comes from the U.S. Embassy via Twitter feed –BeijingAir. The description at Twitter indicates that the data comes from a MetOne BAM 1020 particle monitor located in NE Chaoyang District. 
  2. Air quality index as below (from –AirNow.gov):
Air Quality Index Levels of Health Concern Numerical
Value
Meaning
Good 0 to 50 Air quality is considered satisfactory, and air pollution poses little or no risk.
Moderate 51 to 100 Air quality is acceptable; however, for some pollutants there may be a moderate health concern for a very small number of people who are unusually sensitive to air pollution.
Unhealthy for Sensitive Groups 101 to 150 Members of sensitive groups may experience health effects. The general public is not likely to be affected.
Unhealthy 151 to 200 Everyone may begin to experience health effects; members of sensitive groups may experience more serious health effects.
Very Unhealthy 201 to 300 Health warnings of emergency conditions. The entire population is more likely to be affected.
Hazardous 301 to 500 Health alert: everyone may experience more serious health effects.


发表评论

邮箱地址不会被公开。

此站点使用Akismet来减少垃圾评论。了解我们如何处理您的评论数据